
Bitcoin has seen a decline below the $93,000 level during the past day. Here’s what the trend in one indicator suggests may be behind this downturn.
Bitcoin Coinbase Premium Gap Cools Down
As CryptoQuant community analyst Martunn explains in a new Post On X, the Coinbase Premium Gap has recently returned to neutral levels. Here “Coinbase Premium Gap” refers to an indicator that tracks the difference between the Bitcoin price listed on Coinbase (USD pair) and the Bitcoin price listed on Binance (USDT pair).
This metric essentially tells us how buying or selling behavior differs between the user bases of two cryptocurrency exchanges. Coinbase’s main traffic is made up of US investors, especially large institutional entities, while Binance serves investors from around the world.
When the value of Coinbase Premium Gap is positive, it means that US-based whales are participating in buying in higher volume or selling in lower volume than Binance users, which is why the asset is more expensive on Coinbase. Similarly, it being negative indicates net higher buying pressure on Binance.
Now, here is a chart that shows the trend of the Bitcoin Coinbase Premium Gap over the past few days:
As shown in the above graph, Bitcoin Coinbase Premium Gap was previously at remarkably positive levels, but over the past day, its value has dropped to neutral zero points.
According to Martunn, the source of the positive premium was MicroStrategy’s latest buying spree. Indeed, the cooldown in the indicator coincides with the completion of a $5.4 billion purchase by Michael Saylor’s firm. The company’s significant accumulation had helped the cryptocurrency maintain its recent highs, but with buying pressure waning, Bitcoin has returned to price levels below $93,000.
BTC and Coinbase Premium Gap have maintained a close relationship throughout 2024, so the metric is one to keep an eye on in the near future, as where it goes next could once again foreshadow the asset’s next destination. Naturally, a drop into the negative territory could create more bearish conditions for its price.
In some other news, the Bitcoin Active Addresses indicator has seen a sharp surge recently, as Martunn shared in another PostThis metric tracks the daily number of addresses that are participating in some type of transaction activity on the network.
Below is the chart shared by CryptoQuant analyst for the 14-day simple moving average (SMA) of active addresses:
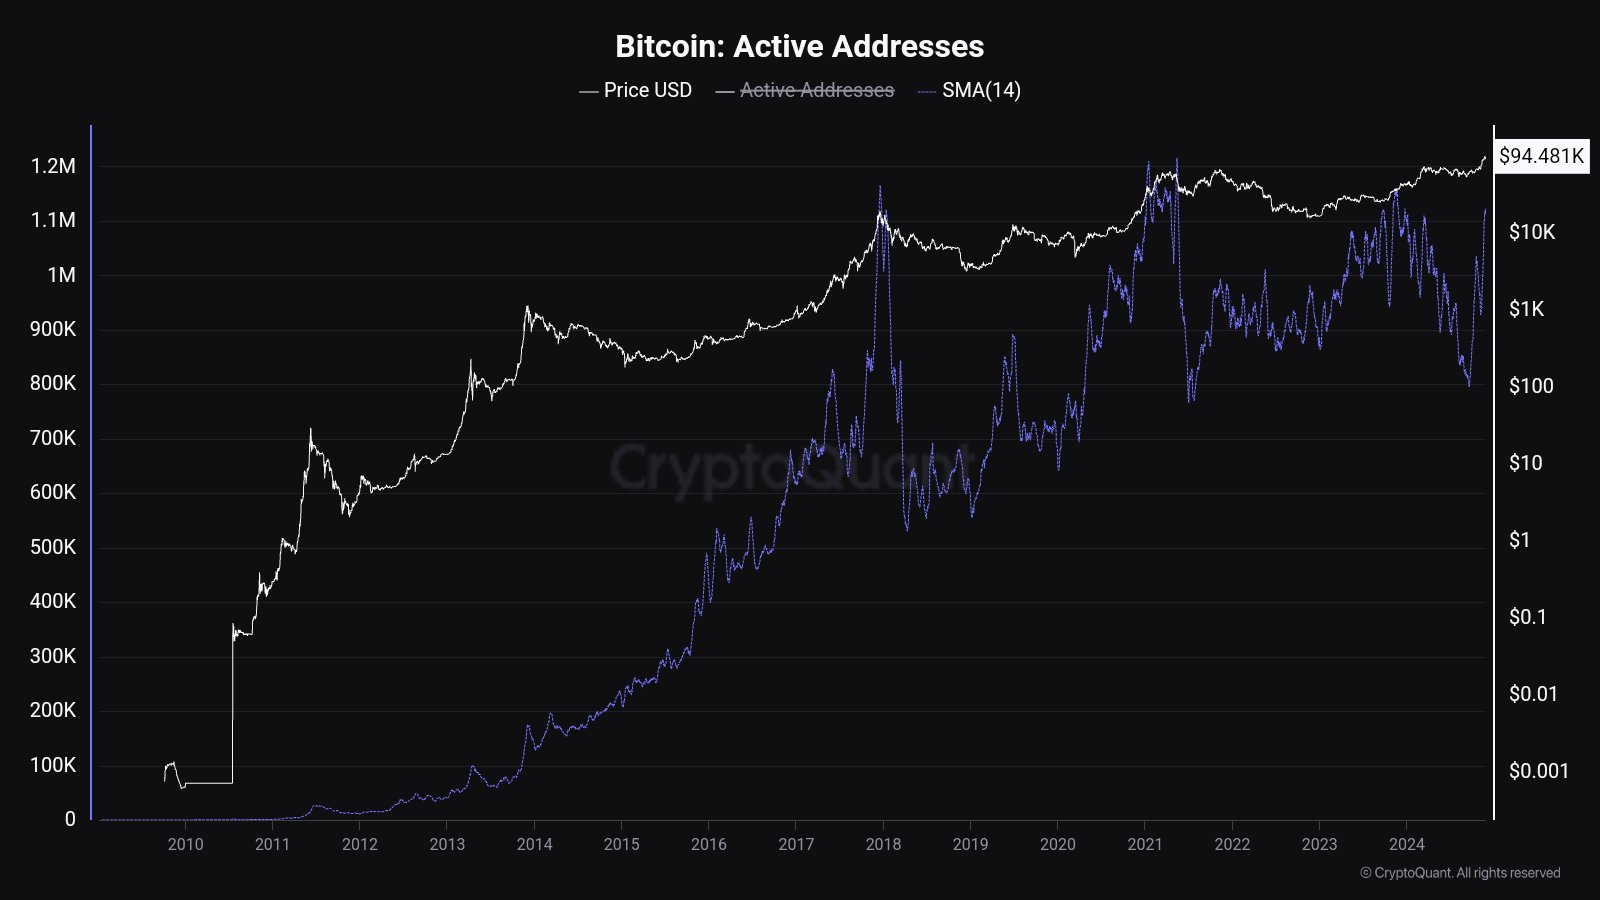
With this latest surge, the 14-day SMA for Bitcoin Active Addresses has reached its highest point in eleven months. This shows that there has been a lot of activity on the network recently. Given that the asset has declined over the past few days, however, the latest user interest certainly hasn’t come down to buying.
btc price
At the time of writing, Bitcoin is floating around $92,400, down about 6% in the last 24 hours.


